Dashboard Metrics
The Dashboard provides a comprehensive overview of your call activity through quick stats and interactive charts.
Quick Stats
At the top of the dashboard, you'll find three key metrics displayed as cards:
| Metric | Description |
|---|---|
| Total Calls | The combined count of all incoming and outgoing calls |
| Incoming | Number of calls received |
| Outgoing | Number of calls made |

Charts
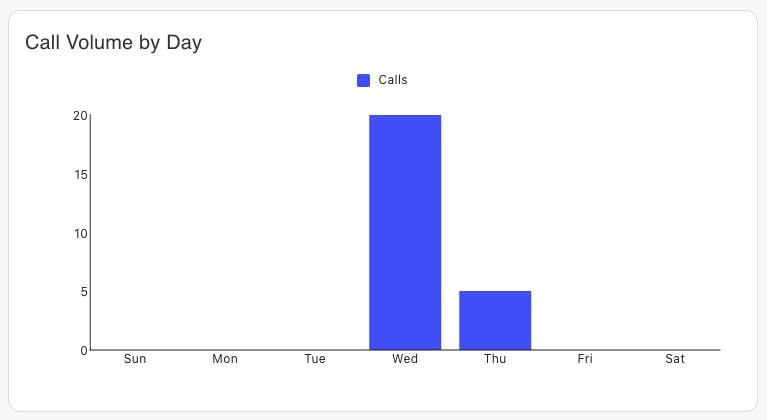
Call Volume by Day
A bar chart displaying call volume grouped by day of the week (Sunday through Saturday) for the past 30 days. This helps identify which days receive the most calls, enabling better staffing and resource planning.
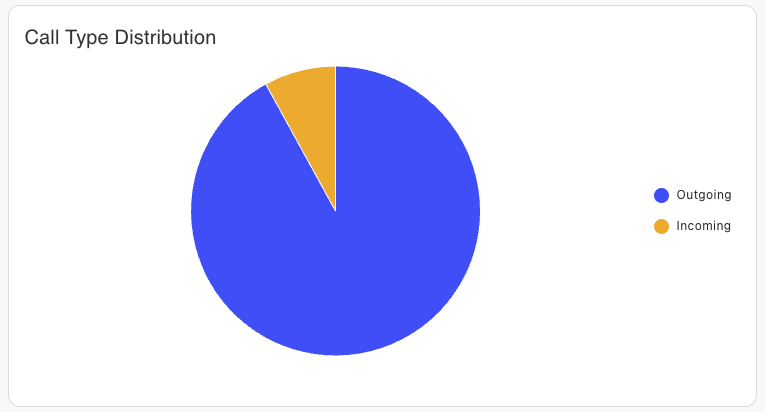
Call Type Distribution
A pie chart showing the proportion of incoming vs outgoing calls. Use this to understand your call direction trends at a glance.
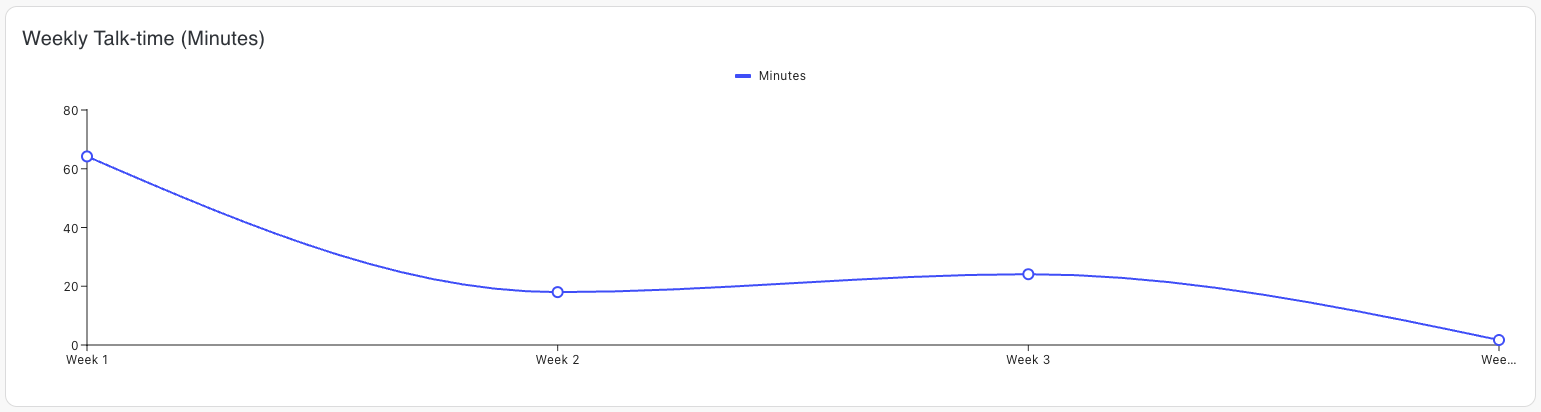
Weekly Talk-time
A line chart tracking total talk-time in minutes over multiple weeks. This metric helps monitor overall call engagement and usage trends over time.